論文のコーディング
1 2 3 4 5 6 7 8 9 10 11 12 | library(metafor)library(MAc)## Study Coding# Ne = sample size for treated Nc = sample size for untreatedStudy Variable1 Variable2 Ne Nc g01 XXX YYY 12 12 1.0202 XXX YYY 15 18 0.9803 XXX YYY 32 29 0.66## Pre-Post DesignでMeta Analysis (Cohen, 1988)# 効果量gはpooled standard deviation (SD ^ 2 = [SD1 + SD2] / 2) で計算# sample sizeで調整する方法もある# Morris, S. B., & DeShon, R. P. (2002). Combining effect size estimates in meta-analysis with repeated measures and independent group designs. <em>Psychological Methods</em>, <em>7</em>, 105-125.) |
メタ分析の実行
1 2 3 4 5 6 7 8 9 10 11 | ## Effect SizeのSampling Variances (SV) を計算df <- (dat$Ne + dat$Nc) - 2j <- 1 - (3 / (4 * df - 1))g <- j * dat$gES <- gSV <- (((dat$Ne + dat$Nc) / (dat$Ne * dat$Nc)) + ((dat$ES * dat$ES) / (2 * (dat$Ne + dat$Nc))))## Random-Effect ModelRE.res <- rma(ES, SV, method = "REML", data = dat, slab = paste(dat$Study))## Mixed-Effect Model# modsは調整変数ME.res <- rma.mv(ES, SV, method = "REML", data = dat, mods =~ dat$Variable1 + dat$Variable2, slab = paste(dat$Study)) |
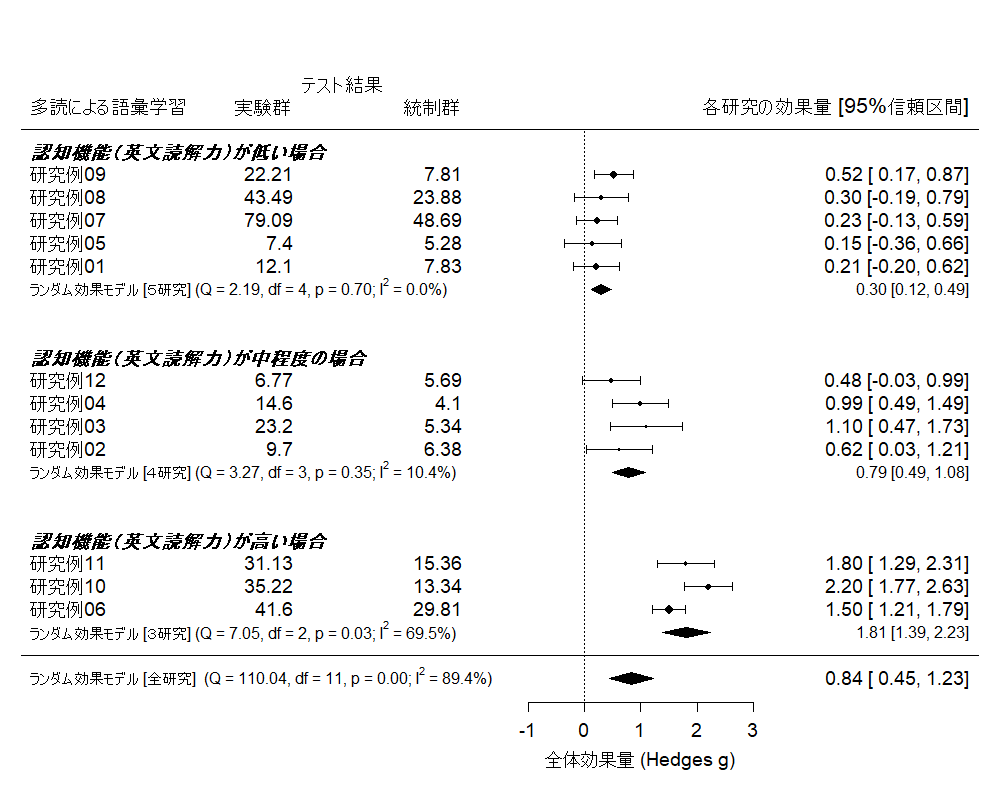
フォレストマップによる結果の可視化
1 2 3 4 5 6 7 8 9 10 11 12 13 14 15 16 17 18 19 20 21 22 23 24 25 | ## Forestmapによるプロットforest( RE.res, slab = paste(dat$Study), xlim = c(-10, 7), ylim = c(-1, 25), xlab = "全体効果量 (Hedges g)", mlab = "", ilab = cbind(dat$Ne, dat$Nc), ilab.xpos = c(-5, -2), ilab.pos = 2, pch = 18, cex = 0.9, order = order(dat$認知機能), row = c(2 : 4, 9 : 12, 17 : 21) )text(-10, 24, "多読による語彙学習", pos = 4)text(c(-5.7, -2.7), 24, c("実験群", "統制群"))text(-4.3, 25, "テスト結果")text(7, 24, "各研究の効果量 [95%信頼区間]", pos = 2)text(-10, -1, pos = 4, cex = 0.75, bquote(paste("ランダム効果モデル (Q = ", .(formatC(RE.res$QE, digits = 2, format = "f")), ", df = ", .(RE.res$k - RE.res$p), ", p = ", .(formatC(RE.res$QEp, digits = 2, format = "f")), "; ", I^2, " = ", .(formatC(RE.res$I2, digits = 1, format = "f")), "%)")))text(-10, c(22, 13, 5), pos = 4, c("認知機能(英文読解力)が低い場合", "認知機能(英文読解力)が中程度の場合", "認知機能(英文読解力)が高い場合"), font = 4) |
調整変数分析
1 2 3 4 5 | # Moderator Analysis with Random-Effect ModelVar1 <- macat(dat$g, SV, mod = dat$Variable1, data = dat, method = "random")Var2 <- macat(dat$g, SV, mod = dat$Variable2, data = dat, method = "random")print(Var1)print(Var2) |
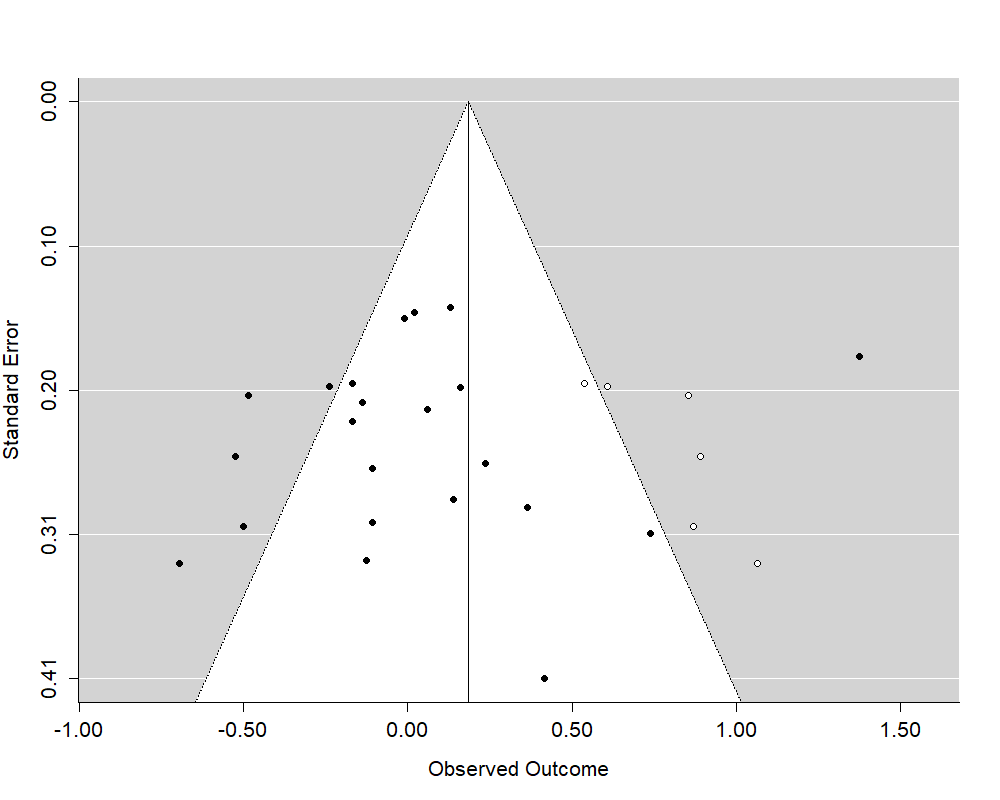
出版バイアス分析とファンネルプロット
1 2 3 4 5 6 7 8 | # Publication Bias Analysis with Funnel Plotfunnel(RE.res, digits = 2, addtau2 = F, type = "rstandard") # バイアスがある場合はTrim-Fillの結果を図示regtest(RE.res, model = "lm") # 分布の対称性の検定trimfill(RE.res, side = "right", estimator = "R0") # Trim-Fill MethodによるMissing Studyの推定trimfill(RE.res, side = "left", estimator = "R0")trimfill(RE.res, side = NULL, estimator = "L0", maxiter = 1000)trimfill(RE.res, side = NULL, estimator = "R0", maxiter = 1000)fsn(y = RE.res$yi, v = RE.res$vi) # Fail-Safe N |