潜在成長曲線モデル
1 2 3 4 5 6 7 8 9 10 11 12 13 14 15 16 | library(lavaan)## Latent Growth Curve Model# 5時点での測定 (t1 ~ t5) と説明変数 (subject) のあるモデルmodel <- ' intercept =~ 1*t1 + 1*t2 + 1*t3 + 1*t4 + 1*t5 slope =~ 0*t1 + 1*t2 + 2*t3 + 3*t4 + 4*t5 # 線形でない場合は2乗した値を指定 intercept ~~ slope intercept ~ subject slope ~ subject '# モデリングと結果の出力fit <- sem(model, data = dat, estimator = "ML")fit <- growth(model, data = dat, estimator = "ML")summary(fit, fit.measures = T, standardized = T, rsquare = T)# ロバスト推定: estimator = "MLM"# 完全情報最尤推定法 (Full Information Maximum Likelihood): missing = "FIML"# 欠損データが完全にランダム (Missing Completely At Random) か観測データに依存する (Missing At Random) 場合に適用可 |
適合度指標とモデルの修正
1 2 3 4 5 6 7 8 9 10 11 12 13 14 15 16 | # Goodness of fit statisticsfitMeasures(fit)npar fmin chisq df pvalue baseline.chisq baseline.df baseline.pvalue19.000 0.096 38.362 17.000 0.002 465.296 28.000 0.000cfi tli nnfi rfi nfi pnfi ifi rni0.951 0.920 0.920 0.864 0.918 0.557 0.952 0.951logl unrestricted.logl aic bic ntotal bic2-2148.404 -2129.223 4334.809 4397.477 200.000 4337.283rmsea rmsea.ci.lower rmsea.ci.upper rmsea.pvalue rmr rmr_nomean0.079 0.046 0.113 0.072 0.073 0.073srmr srmr_bentler srmr_bentler_nomean srmr_bollen srmr_bollen_nomean srmr_mplus srmr_mplus_nomean0.061 0.061 0.061 0.061 0.061 0.061 0.061cn_05 cn_01 gfi agfi pgfi mfi ecvi 144.825 175.175 0.950 0.894 0.449 0.948 0.382# Model Modification Indicesmodificationindices(model) |
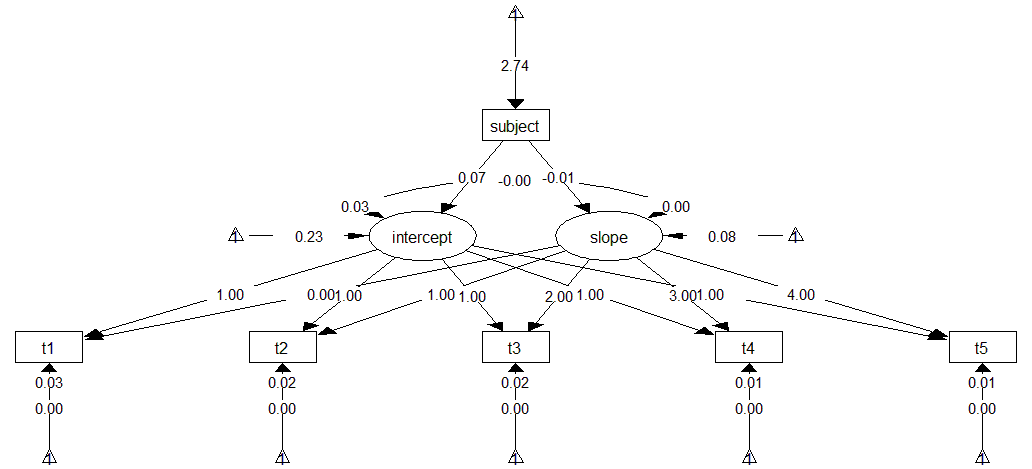
パス図の描画
1 2 3 4 5 6 7 8 9 10 11 12 13 14 15 16 17 18 19 20 21 22 23 24 25 26 27 28 29 30 31 32 33 34 35 36 37 38 39 40 41 42 43 44 45 46 | library(semPlot)# よく使う引数semPaths( fit, # 描画するモデル what = "stand", # 描画する数値: stand (標準化推定値), est (非標準化推定値) intercepts = FALSE, # 切片を描画しない style = "lisrel", # (残差) 分散の描画方法: ram / lisrel layout = "tree", # レイアウト方法: 基本的にtree curve = 1.0, # パスの曲率 sizeMan2 = 3, # 観測変数ノードの高さ sizeLat2 = 3, # 潜在変数ノードの高さ nCharNodes = 0, # 変数名を省略しない nCharEdges = 0, # 推定値を省略しない edge.label.cex = 0.5, # 推定値のフォントサイズ fade = FALSE, # 推定値の大きさでパスの色を薄くしない edge.width = 0.3, # パスの太さ edge.label.position = 0.5, # 推定値をパス上のどこに置くか node.width = c(0.9, 0.9, 0.9, 0.9, 0.9), # ノードの幅を個別に指定 label.scale = FALSE, # 変数名のフォントサイズをノードの幅で変化させない label.cex = 1, # 変数名のフォントサイズ theme = 'gray', # グレースケールにする asize = 3.0, # 矢尻の大きさ arrowAngle = pi/6, # 矢尻の角度 optimizeLatRes = TRUE # 残差の推定値が重ならないようにする )# Latent Growth Curve ModelsemPaths( fit, title = FALSE, whatLabels = "est", style = "lisrel", edge.label.cex = 1.0, layout = "tree", rotation = 1, nCharNodes = 0, nCharEdges = 0, fade = FALSE, optimizeLatRes = TRUE, edge.width = 0.2, edge.color = "black", label.scale = FALSE, label.cex = 1.0, theme = 'gray', asize = 6.0, node.width = 0.8 ) |